


Monitoring Live Streams
Introduction
Stream Health is a built-in monitoring feature that gives a continuous visibility into the quality of a live input stream. As soon as the stream goes live, Qencode starts collecting key performance metrics every 10 seconds — including video and audio bitrate, framerate, and resolution — and makes them available in both a visual dashboard and API.
Use Stream Health to:
- Catch quality problems early, before they affect your viewers
- Investigate past incidents by reviewing historical metric data
Summary Panel
At the top of the Stream Health page, a summary panel shows the most recent values recorded during the last active session.
| Metric | What it shows |
|---|---|
| Video Bitrate | Measured ingest video bitrate (Kbps) |
| Audio Bitrate | Measured ingest audio bitrate (Kbps) |
| Framerate | Frames per second being received (fps) |
| Resolution | Input stream resolution |
Video Bitrate
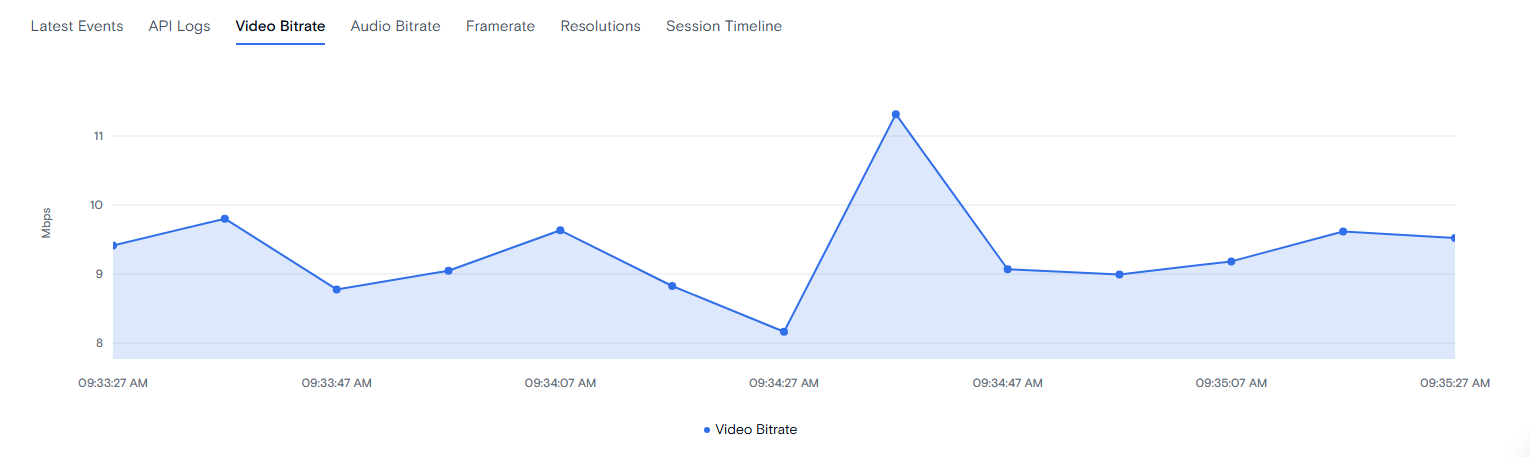
The Video Bitrate tab displays a time-series area chart of the measured input video bitrate over the selected time range.
Use this chart to identify drops or spikes in video quality. A stable stream should hold a relatively flat line near your target bitrate. Sudden drops may indicate network congestion or encoder instability on the sender side. Spikes above your expected bitrate can indicate a misconfigured encoder.
Audio Bitrate
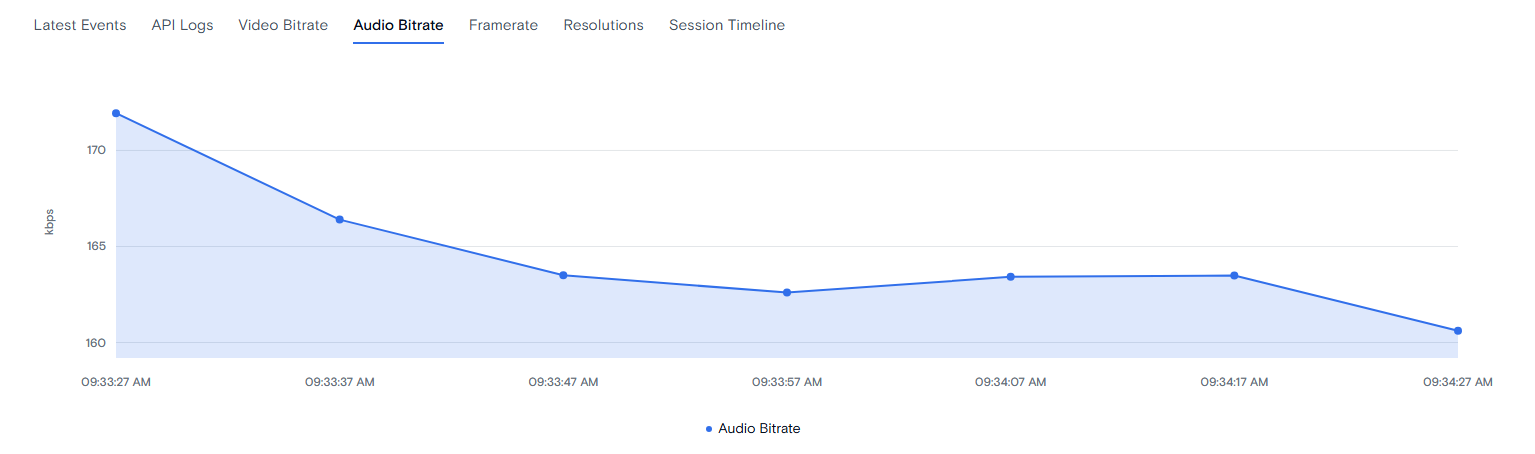
The Audio Bitrate tab displays a time-series area chart of the measured input audio bitrate over the selected time range.
The curve here often mirrors the video bitrate chart. A sudden drop in audio bitrate — especially if the video bitrate remains stable — usually points to an issue with audio encoding on the sender side.
Framerate
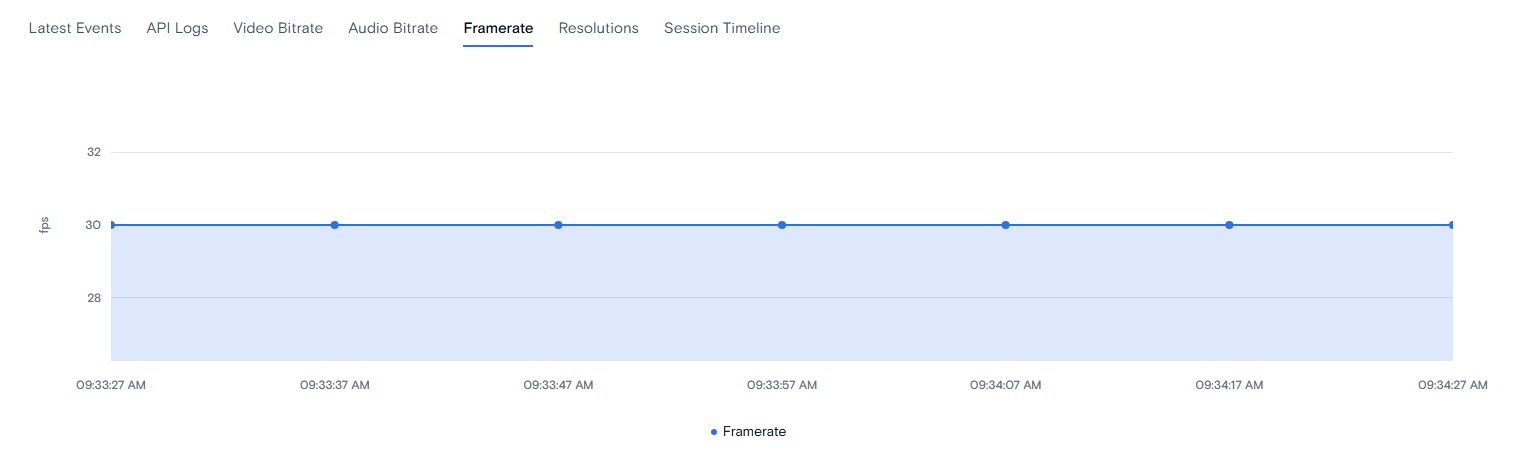
The Framerate tab displays a time-series area chart of the measured input frames per second over the selected time range.
A healthy stream holds a steady line close to your target FPS (for example, 30 fps). Dips below the target suggest the encoder is struggling to maintain output — typically due to CPU load, insufficient upload bandwidth, or an unstable source.
Resolutions
The Resolutions tab displays a proportional bar showing the distribution of input resolutions detected during the selected period.

Session Timeline
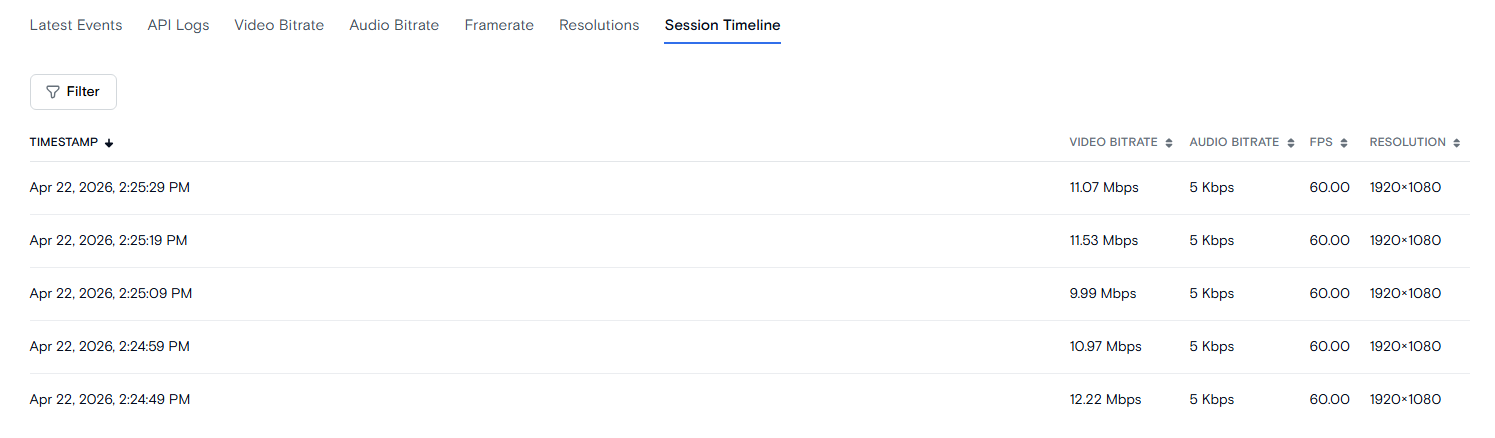
The Session Timeline tab displays a paginated table of raw metric samples, sorted by timestamp from newest to oldest. Each row represents one 10-second health snapshot and includes the following columns:
| Column | Description |
|---|---|
| Timestamp | UTC time the sample was recorded |
| Video Bitrate | Measured video bitrate for that interval (kbps) |
| Audio Bitrate | Measured audio bitrate for that interval (kbps) |
| FPS | Measured framerate - highlighted in red if below expected |
| Resolution | Input resolution at that moment (e.g. 1920x1080) |
Use the Session Timeline when you need to pinpoint exactly when a quality issue occurred and correlate it with events in your encoder or network logs.
API Reference
Stream health metrics are available via the API for programmatic access, automation, or integration with external monitoring systems.
Endpoint
GET /v1/live-streams/{stream_id}/healthQuery Parameters
| Parameter | Type | Default | Description |
|---|---|---|---|
| time_from | datetime string | Start of current or last live session | Start of the query window |
| time_to | datetime string | (none) | End of the query window |
| time_bucket | string | 'absent' — raw mode | Enables aggregation. When set to 'auto', the interval is calculated automatically to return up to 50 buckets. Set to none to explicitly disable aggregation and return raw samples. Possible values: 'auto', '1m', '5m', '1h', '1d', '1w', '1M', 'none' |
| limit | integer | 1000 | Maximum number of rows returned |
| no_time_filter | boolean | false | When 'true', disables the default time window and returns all records for the stream regardless of timestamp. Applies in raw mode only. |
Response Example
{
  "metrics": [...],
  "count": 42,
  "aggregated": false,
  "time_bucket": null,
  "interval": null,
  "summary": { ... },
  "time_from": "2026-03-13 16:00:00",
  "time_to": "2026-03-13 17:00:00"
}
Response Fields
| Field | Type | Description |
|---|---|---|
| metrics | array | Array of metric samples — fields depend on raw vs. aggregated mode (see below) |
| count | integer | Number of items in the metrics array |
| aggregated | boolean | 'true' when time_bucket aggregation is active, 'false' for raw mode |
| time_bucket | string | The bucket interval used (e.g. 5m), or null in raw mode |
| interval | integer | Seconds per bucket when time_bucket='auto'; null otherwise |
| summary | object | Statistical summary across the queried range (see Summary Object below); null when the stream has no data |
| time_from | string | Start of the queried window |
| time_to | string | End of the queried window |
Raw Mode Response (aggregated: false)
Returned when time_bucket is absent or set to none. Rows are ordered newest first.
{
  "stream_id": "abc123",
  "timestamp": "2026-03-13 17:00:00",
  "video_bitrate": 5824,
  "audio_bitrate": 192,
  "framerate": "29.97",
  "time_connected": 3720,
  "encoder": "RTMP Client",
  "video_codec": "H264",
  "video_data_rate": 5000,
  "resolution": "1920x1080",
  "input_frame_rate": "29.97",
  "audio_codec": "AAC",
  "audio_data_rate": 192,
  "audio_channels": 2,
  "audio_sample_rate": 44100,
  "audio_sample_size": 16
}| Field | Type | Description |
|---|---|---|
| stream_id | string | Unique stream identifier |
| timestamp | string | UTC timestamp of the sample |
| video_bitrate | integer | Measured input video bitrate (kbps) |
| audio_bitrate | integer | Measured input audio bitrate (kbps) |
| video_data_rate | integer | Video track bitrate (Kbps) — user-configured value if set, otherwise measured |
| audio_data_rate | integer | Audio track bitrate (Kbps) |
| framerate | string | Measured input framerate (fps) |
| input_frame_rate | string | Video track framerate - user-configured value if set, otherwise measured |
| time_connected | string | Seconds elapsed since stream input was created |
| resolution | string | Input resolution (e.g. 1920x1080) |
| encoder | string | Source type (e.g. RTMP Client, WebRTC Client, SRT Client) |
| video_codec | string | Input video codec (e.g. H264) |
| audio_codec | string | Input audio codec (e.g. AAC) |
| audio_channels | integer | Number of audio channels |
| audio_sample_rate | integer | Audio sample rate (Hz) |
| audio_sample_size | integer | Audio sample size (bits) |
Aggregated Mode Response (aggregated: true)
Returned when time_bucket is set to any value other than none. Rows are ordered oldest first.
{
  "time_bucket": "2026-03-13 17:00:00",
  "sample_count": 6,
  "avg_video_bitrate": 5600,
  "min_video_bitrate": 4800,
  "max_video_bitrate": 5824,
  "avg_audio_bitrate": 192,
  "min_audio_bitrate": 190,
  "max_audio_bitrate": 194,
  "avg_framerate": 29.95,
  "min_framerate": 29.80,
  "max_framerate": 29.97,
  "avg_input_frame_rate": 29.97,
  "avg_video_data_rate": 5000,
  "avg_audio_data_rate": 192,
  "max_time_connected": 3720,
  "resolution": "1920x1080",
  "video_codec": "H264",
  "audio_codec": "AAC",
  "encoder": "RTMP Client"
}| Field | Type | Description |
|---|---|---|
| time_bucket | string | Start timestamp of this bucket |
| sample_count | integer | Number of raw samples aggregated into this bucket |
| avg/min/max_video_bitrate | integer | Video bitrate statistics for the bucket (Kbps) |
| avg/min/max_audio_bitrate | integer | Audio bitrate statistics for the bucket (Kbps) |
| avg/min/max_framerate | integer | Framerate statistics for the bucket |
| avg_input_frame_rate | integer | Average video track framerate for the bucket |
| avg_video_data_rate | integer | Average video track bitrate for the bucket (Kbps) |
| avg_audio_data_rate | integer | Average audio track bitrate for the bucket (Kbps) |
| max_time_connected | integer | Maximum time connected value seen in this bucket (seconds) |
| resolution | string | Input resolution during this bucket |
| video_codec | string | Video codec during this bucket |
| audio_codec | string | Audio codec during this bucket |
| encoder | string | Source type during this bucket |
Summary Object
The summary field is always present in the response and provides statistical aggregates across the entire queried time range.
"summary": {
  "total_samples": 360,
  "video_bitrate": { "avg": 5600, "median": 5700, "min": 4800, "max": 5824, "p10": 5000, "p90": 5800 },
  "audio_bitrate": { "avg": 192, "median": 192, "min": 188, "max": 196, "p10": 190, "p90": 194 },
  "framerate":     { "avg": 29.95, "median": 29.97, "min": 28.50, "max": 29.97, "p10": 29.80, "p90": 29.97 },
  "resolution": "1920x1080"
}| Field | Type | Description |
|---|---|---|
| total_samples | integer | Total number of 10-second samples in the queried range |
| video_bitrate | object | avg, median, min, max, p10, p90 of video bitrate across all samples (bps) |
| audio_bitrate | object | avg, median, min, max, p10, p90 of audio bitrate across all samples (bps) |
| framerate | object | avg, median, min, max, p10, p90 of framerate across all samples |
| resolution | object | Most common resolution during the queried range |
Need More Help?
For additional information, tutorials, or support, visit the Qencode Documentation page or contact Qencode Support at support@qencode.com.